Information Design
 |
| Nigel Holmes |
- Shows range of data
- Shows relationships and patterns in data
- Not good for showing tiny details
- Commonly used as supporting item
- Nigel Holmes - does graphical graphs (see image)
- Tells a story through visual means
Maps
- A map is a diagram
- Shows geography
Not always good for showing data and specific location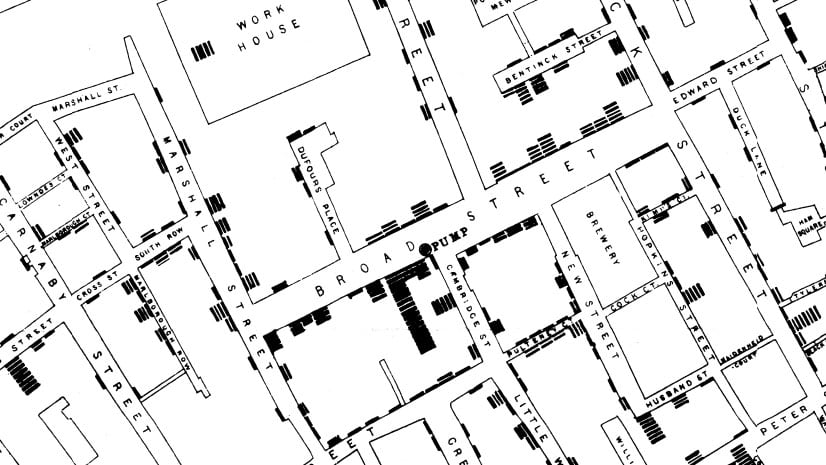
Dr John Snow - Used at the start of articles and books
- Dr John Snow's cholera Map helped detect where cholera came from
- Dennis Wood Street Light Map, showed street lights and also where people put pumpkins on halloween (turns out these were the posh areas)
| Dennis Wood |
 |
| Dennis Wood Lights |
 |
| UOW Drawing |
Ikea
- Use of basic graphics with line drawing to help people build their items.
Diagrams
 |
| Carl Sagan |
- Pioneer 10 Probe Plaque - Carl Sagan - Line etchings on plaque, shows silhouette of the probe in order to give scale. Also shows map relating to the solar system.
- Twitter diagram - David McCandless - coloured pictogram for web users, shows the proportions of twitter users in various scenarios.
Staged Diagrams - This to that...
 |
| David McCandless |
Comments
Post a Comment